

End-to-end flow from Data Warehousing to PowerBI: simplify real-time data analysis
In today's data-driven business sphere, transforming data into valuable insights is crucial for strategic decision-making. The complete flow from Data Warehousing to PowerBI emerges as an essential bridge between various data sources and dynamic reports in Microsoft PowerBI.
In this article, we explore the process from collecting data to presenting it in dynamic dashboards. We highlight its simplified approach to providing valuable insights in an agile way, as well as the importance of the Data Warehouse as the epicentre of the process, automation for continuous efficiency and the transformation of data by PowerBI.
End-to-end Data Warehouse flow
Ensures a holistic and integrated approach to data management and analysis
The end-to-end flow represents the complete data journey, from its source, whether on-premise, in the cloud or otherwise, to its final display in dashboards and reports. It starts with the collection of data from various sources, such as transactional databases or CRM systems, through to the presentation of intuitive visualisations. This process includes transforming and cleansing the data using ETL (Extract, Transform, Load) techniques in a centralised Data Warehouse.
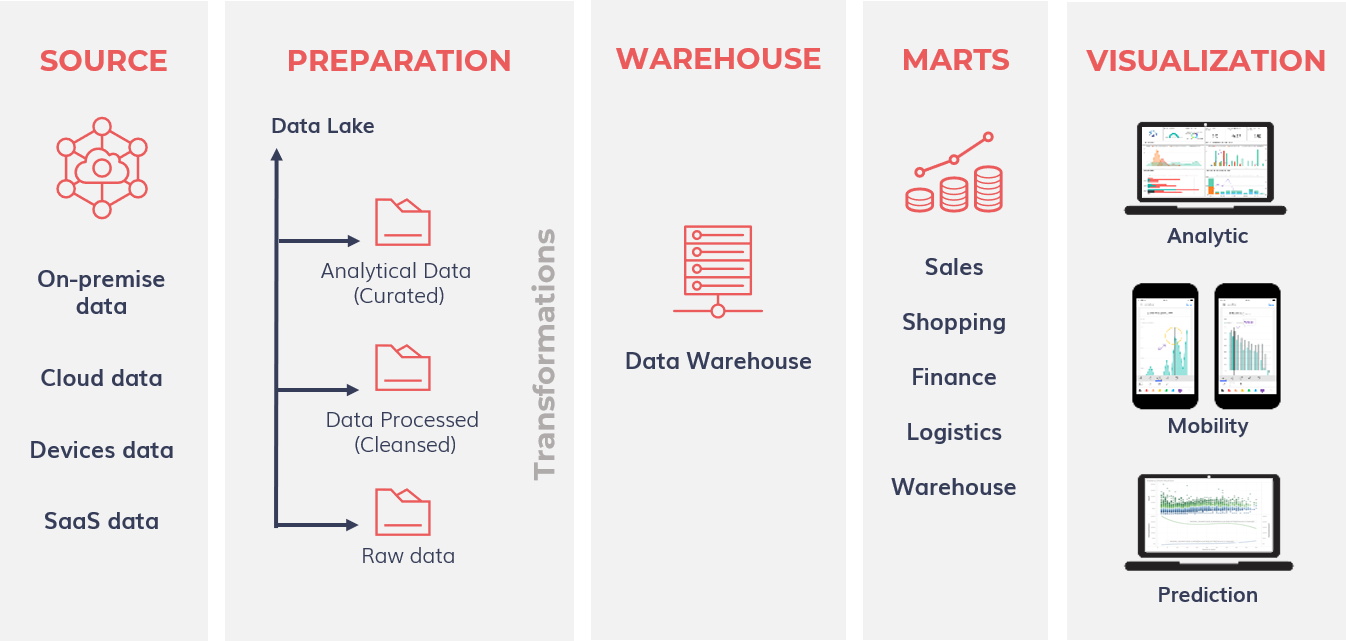
This end-to-end Data Warehouse flow covers several crucial phases for effective data management and analysis:
- Origin: data is extracted from various sources, including operational databases, external systems and real-time feeds.
- Preparation in the Data Lake: the data is organised and stored in the Data Lake for future analysis, undergoing aggregation and organisation processes.
- Transformation: this stage involves cleaning, normalising and enriching the data, preparing it to be loaded into the Data Warehouse, where it is modelled and structured for complex queries and analyses.
- Data Marts (DM): specialised subsets of the Data Warehouse, focused on specific business areas or departments, providing targeted insights.
- Visualisation: data is presented intuitively and interactively through dashboards, reports and other analysis tools, allowing end users to extract valuable insights for decision-making.
This complete cycle, from source to visualisation, guarantees a holistic and integrated approach to data management and analysis throughout the organisation.
Data Warehouse: the epicentre of the process
The Data Warehouse acts as the "heart" of the process by providing a centralised and optimised repository for data analysis. Here, data is modelled and organised in such a way as to facilitate complex queries and multidimensional analysis. Using data models such as Star Schema or Snowflake Schema, the Data Warehouse offers a flexible structure for storing and accessing historical real-time data.
Full flow automation: efficiency without interruptions
Automation plays a crucial role in the entire flow, enabling the continuous and efficient execution of tasks such as data ingestion, data transformation and dashboard updating. Workflow automation and orchestration tools ensure that the process is carried out reliably and without manual intervention, increasing scalability and reducing flow execution time.
PowerBI Dashboard: turning data into insights
After collecting and storing data in the Data Warehouse, Microsoft PowerBI offers a powerful platform for data visualisation, enabling the creation of dynamic graphs, interactive tables and customised dashboards. With an intuitive interface and advanced analysis features, PowerBI empowers users to explore data in greater depth and discover actionable insights.
PowerBI Dashboard examples
To illustrate the potential of PowerBI, here are some examples of dashboards that can be created:
- Sales: visualisation of sales trends over time, product performance analysis and customer segmentation.
- Marketing: monitoring the ROI of marketing campaigns, analysing acquisition channels and demographic segmentation.
- Human resources: monitoring employee turnover, analysing employee satisfaction and recruitment trends.
- Financial management: comprehensive overview of a company's key financial metrics, including revenues, expenses, profits, cash flow and profitability analysis by product, region or customer.
- Production: ideal for industrial companies, it monitors production efficiency, product life cycle time and machine utilisation.
- Quality: analyses quality metrics such as defect rates, revisions, compliance with standards and quality trends over time.
- Project management: overview of project progress, budget, schedule, resource allocation and identification of possible risk areas.
PowerBI Gateway: ensure secure connectivity
To ensure secure connectivity between PowerBI and the Data Warehouse, whether on-premise or in the cloud, the PowerBI Gateway plays a crucial role. This service allows PowerBI to access data located in on-premise sources securely and efficiently, guaranteeing data integrity and confidentiality.
Turn data into powerful decisions with Izertis
Izertis, as a Microsoft CSP partner, provides excellent solutions
The complete flow from Data Warehousing to PowerBI represents a continuous and highly effective process for transforming data into actionable insights. By simplifying this flow and taking advantage of automation and data visualisation technologies, organisations can make more informed and agile decisions, driving success in today's increasingly data-driven businesses.
Izertis, as a Microsoft CSP partner, offers excellent solutions that enable companies to extract maximum value from their data, shaping the future of their business with powerful, action-orientated insights. Take your business to the next level with agile and effective data analyses. Find out more on our Data Intelligence page to discover how we can boost your success.